

Do You Know How Your Exam Questions are Performing?
Using exam data to provide students with feedback on their academic progress is important, but using the data to improve test questions and exams as a whole is equally important. The word “psychometrics” can be daunting to some educators—there seem to be a lot of equations involved in figuring out what all of these statistics mean. ExamSoft’s item analysis report makes it easy, though—we’re here to provide an easily digestible explanation of how your questions are performing, and how to help make them even stronger to help assess your students accurately.
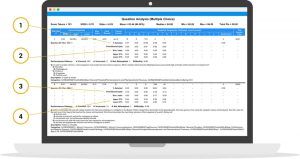
Percent Correct (p-value)
What percentage of your students who took the exam got this question correct. What counts as a good p-value depends on the intention of the question. This stat is your first indication of how your question performed, but shouldn’t be the only piece of data used to determine validity.
Discrimination Index
The difference in question performance within an exam between top performing students and bottom performing students. If lower performing students are getting this question correct more often than your top performing students, this could indicate a problem with the item. A good index of discrimination can vary, based on other stats from this item.
Upper/Lower 27 Percent
Of the students who scored in the top or bottom 27 percent of exam takers, what percentage of those specific subgroups got the question correct. This can be useful in determining what distractors drew students away from the correct answer.
Point Biserial
Indicates whether getting the question correct correlates positively or negatively with performing well on the exam as a whole. Unlike the discrimination index, point biserial incorporates performance of all students instead of the two specific subgroups.
There are lots of guidelines relating to the use of psychometrics. While these rules might generally be correct, you should always remember that your specific circumstances are unique, and to take each rule with a grain of salt. Most importantly, educators must remember that there are many non-statistical factors that can influence the performance of a question, and these factors must be taken into account when determining a question’s validity.
Need Extra Support?
If you have questions about interpreting your ExamSoft item analysis statistics, we’re happy to help.
-
- Email: tlc@neco.edu
- Send us a request: Request Support